Something amusing (or perhaps absurd?) that I noticed the other day.
An old article in The Australian from October 10, 2013: Climate change tipping point revealed by study published in Nature.
THE dreaded climate-change "tipping point", when changes to weather patterns will become irreversible, has been identified. And it is terrifying.
Starting in about a decade, Kingston, Jamaica, will probably be off-the-charts hot - permanently. Other places will soon follow. Singapore in 2028. Mexico City in 2031. Cairo in 2036. Phoenix and Honolulu in 2043.
Australia will not be far behind, with dates ranging from 2038 in Sydney to 2049 in Adelaide.
Virtually the whole world will have changed by 2050.
This, as usual, is all based on computer models:
To arrive at their projections, the researchers used weather observations, computer models and other data to calculate the point at which every year from then on will be warmer than the hottest year ever recorded over the past 150 years.
So how well are they doing? They give a long list of cities and the dreaded year when all h*** breaks loose in the poor blighted district. Examples:
Melbourne 2045
Sydney 2038
Perth 2042
Adelaide 2049
Conveniently far enough out that we'll all have forgotten this piece of idiocy when the prediction fails to come to pass. But someone didn't do their proofing well enough! They let slip one near-term prediction:
Manokwari (West Papua) 2020
Well we're nearly half way there. Things should be getting pret-ty sticky in poor Manokwari by now. So how is it panning out?
Manokwari is smack next to Rendani, which is the only place with temperature data recorded in the NOAA-GHCN global data bank. Even that is sketchy:

The grey line is the data, the red line a 12-month running average. The long straight bits on the grey line are missing data. You can probably see the outcome already, but let's amplify the last part where the supposed "end of the world" disaster is developing:
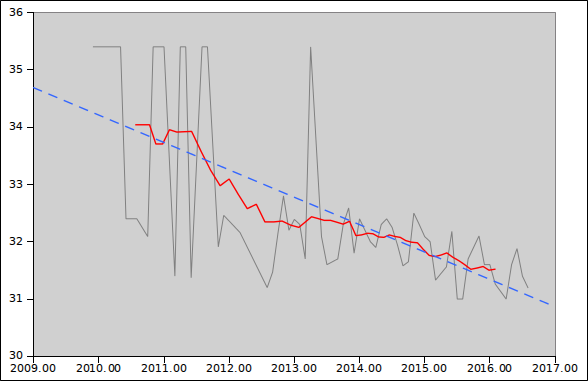
The flat tops at 35.4C look to be an artifact in the measuring equipment. Not promising as the basis for a sky-is-falling alarm. But what has happened since 2013 on the way to a 2020 armagedon?
It is always thus: Panic and alarm, then go quiet when it doesn't turn out as advertised.

Re: Another failing prediction of doom
Hi. Can you post a link to the source for those charts? I'd like to find out exactly what happened to cause the obvious problems with the data set, and what the possible implications may be for interpreting that chart accurately.
Re: Another failing prediction of doom
I made them myself from the data for this station in the global data bank:
Directory:
ftp://ftp.ncdc.noaa.gov/pub/data/globaldatabank/monthly/stage3/recommended/results
File:
ftp://ftp.ncdc.noaa.gov/pub/data/globaldatabank/monthly/stage3/recommended/results/recommended-isti_format.monthly.stage3.v1.1.0.20160906.tar.gz
In that (huge 211MB) archive you need results_merged/merge_IDM00097530_stage3 .
Re the various "stages": I chose stage3 because it seems to be the latest stage before they try to "adjust" things to make them "better".
Re: Another failing prediction of doom
"Re the various "stages": I chose stage3 because it seems to be the latest stage before they try to "adjust" things to make them "better"."
Doesn't such a statement require you to understand what the errors were caused by, their magnitude, and what would be required to compensate for them? Can you explain to me what you understand about this? I'd like to know, but I learn nothing from the explanation that you are going to take one set of figures over another because they are less adjusted. Well, were the adjustments making the record more accurate or not?
Re: Another failing prediction of doom
Well, there are a few interesting things there to look at. I notice that the data refers to RENDANI and MANOKWARI_RENDANI. Does that mean that reading from two different places are being used due to a lack of consistent data from RENDANI. If so, that would require some form of compensation allowing for the nature of the differences in readings from each site.
Well, that's just one issue to be looked at. I'd be curious to know what happens after stage 3, and what they adjust and why, and if it has anything to do with the first issue I raised, or if there is some other thing going on with the stations and the way things are measured. Simply taking raw data and assuming that it is going to give you the most accurate versions of what actually happened, with stations in remote places, and limited knowledge of exactly what was going on there, and how temps were measured is not necessarily going to give you the right answer. I'm reminded by looking at this of things like time of observation bias, and the effects of changes in the location or design or measuring practices at a given station.
So, I think we need more information to be able to tell if adjustments are needed, and whether or not the adjustments that were applied further down the line were justified.
If you already have some insight into this particular record and the circumstances, I'd be grateful if you could tell me what you know. I could try and track down all the information myself, but if you already know, that would save me a lot of time.
Re: Another failing prediction of doom
For some time I have been working on my own reconstruction of the planet's temperature trend, which will be based on "raw" data, meaning data that has not been adjusted for various reasons. If you read the explanatory file, you will see that these stages are:
From the larger description, stage 3 combines separate files describing the same station (they might have been found in different archives, for example), and uses a computer algorithm to resolve any discrepancies. Since I want "untouched by human hands" data, that is as far as I can go. It is the disputes about (esp.) the homogenised products that are the entire point of contention in the dispute about the amount of historical global warming. If I take that data, I have effectively used their method in disguise. Hence I chose stage 3.
I have indeed looked into the various adjustments, time of observation error (TOBs) in particular, and I am preparing a paper describing why these adjustments are much larger than the real value. I am a qualified physicist, with an applied mathematics masters. So no, I am not some naive ignorant blundering where only the "experts" should dare go.
Re: Another failing prediction of doom
Re your second comment about the Rendani / Manokwari problem. If you look at this place on googleearth, it is clear that Rendani is pretty much the name of Manokwari's airport, and they are about 3km apart. Like many places, it would seem that the temperature station is at the airport. The official coordinates in the file:
place it almost on the runway, so I assume they are only approximate. But the airport it is. I very much doubt that a village in West Papua has more than one temperature station in the entire region.
Re TOBs: This error is either present or absent depending on whether readings were made in the evening or morning. Since we are obviously talking about a single station, it either has or does not have TOBs error. If it changes its methodology at some date, the error should show up as a step function in the results. I wouldn't like to make any guesses about the relation of the early data to the later (after the missing chunks), but the final several years show just a slow decline (no step), which cannot possibly be related to TOBs. And pretty much all other changes, such as station moves, should show up as a step function too.
Remember why we are looking at this station: Manokwari is predicted to be the very first place that is utterly unliveable by 2020, with the coolest year being absolutely hotter than the hottest year in the past. Any such extreme claim must also apply to the airport just 3km down the road. For the airport to be gently declining in temperature while the nearby village is so hot it's "terrifying" (to quote the original article) - well, it would take a great deal to convince me that such a divergence doesn't violate the 2nd law of thermodynamics.
This is simply out of the ballpark of any technical disputes about small errors in trend.
Re: Another failing prediction of doom
"Remember why we are looking at this station:"
Lets just make sure we can have confidence in the data first, before trying to decide what it means. To call this particular record problematic would probably be an understatement.
Right now we have a record with obvious problems, big gaps, big jumps to a flat figure, and possible mixing with records from another station, none of which we really know anything about. I wonder if we could get hold of any information about what actually happened there? That would be a good starting point. At the moment it seems that we only have about 4 years of recent information that may not be questionable, but without knowing exactly what caused the problems we can only guess as to the accuracy of the record.
I understand why you want to look at this particular location, but unfortunately it happens to have particularly bad data set. So, step one is figuring out what happened. I wonder where the nearest station to Rendani without such problems is? It would be interesting to see how it compares.
As for the predictions for 2020, I'd be curious to know what concentrations of GHG's the predictions expected by now, by 2020, and how different the expected current level is to to the actual concentration we have now? I also note that the predictions have 5 year error bars.
Anyway, it's certainly an interesting thing to look at. I just don't want to jump to any hasty conclusions one way or another.
Re: Another failing prediction of doom
I should add that I searched the NOAA site for information about MANOKWARI_RENDANI but I couldn't find anything.
Re: Another failing prediction of doom
Also a thought about your second graph. It seems that your running average and trend line aren't excluding data that you have described as being an artifact of some kind of problem. Wouldn't it be more sensible to exclude them altogether? We don't know exactly what caused the error, but it is a big leap to just leave it there and plot as if it was accurate.
Re: Another failing prediction of doom
Hi Philip,
This is pretty much my point. This very station has been more or less announced as fact, as the first place on Earth to flip past the "tipping point". Yet what do we find in the actual data that could possibly justify such confidence in supposedly scientific reports? The place has little short of a dreadful data set.
If the prediction is honest, there are only two realistic possibilities: (1) the prediction has been made on the basis of models, not data, that somehow zero in on that land mass as ground zero of the apocalypse, or (2) somewhere, somehow, there is a data set we are entirely unaware of.
In case (1), the little data we have from 2013 onwards gives a negative suggestion of the predicted disaster, regardless of any missing data or errors before then. Between now and 2020 it is supposed to go off the scale; the gentle decline the past few years means that a very much faster and sudden heating must now happen to fulfil the prediction. Either way, a few more years to go, and we shall see.
BTW it doesn't surprise me that there is no specific mention of this place. How it was chosen as the first domino is a mystery to me.
Re: Another failing prediction of doom
Well, how about we start with a revision of your graph excluding the obviously problematic data. The 35.4C peaks look to most likely rubbish, so how about discarding them and replotting? Then we can move on to other issues.
Re: Another failing prediction of doom
Since we don't know what the apparently bad data should be, just ignore the graph before Sept 2013. The Oct. 2013 claim was that terror would be unleashed here by 2020. How's it going? It's purely a matter of personal opinion, but it doesn't look scary to me.
I forgot, re the 5-year error bars. If you have 5 years on dates like 2050, one should be a lot more certain of 2020. Say, 2 years?
Another thought: Manokwari should be typical of other places in the same weather zone, which is coastal NW New Guinea. Given the nature of the question at issue, it seems to me very irrelevant the precise location of the thermometer, as long as we are looking at the same location, which, at least for these few years, I think we must be.
Re: Another failing prediction of doom
OK, so fix the graph, and we can go from there. Lets at least be looking at a reasonably realistic plot of the figures before we decide what looks scary and what doesn't. As it stands now, the graph you use to challenge their predictions shows a drop in temperature of a few degrees in about 6 years, and you agree that this is likely rubbish.
" I am a qualified physicist, with an applied mathematics masters. So no, I am not some naive ignorant blundering where only the "experts" should dare go."
Well, lead by example. Lets examine the data, look for errors and ways to allow for them, and then try and figure out what it suggests.
Re: Another failing prediction of doom
"I forgot, re the 5-year error bars. If you have 5 years on dates like 2050, one should be a lot more certain of 2020. Say, 2 years?"
Who said the 5 year error bars were for 2050 exclusively, and not for 2020, and can you please explain the reasoning behind your extrapolation? It think you've made a large unsupported leap there.
Re: Another failing prediction of doom
Re both latest comments:
"Fix the data": where the likely bad data is, we simply do not know what it should be. Just cover it up prior to Sept 2013. We only have a small region of believable data.
"...the graph you use to challenge their predictions shows a drop in temperature of a few degrees in about 6 years, and you agree that this is likely rubbish." No I don't agree at all. I am discounting everything before Sep 2013 (which is actually a minimum point). After that the yearly average falls about 1C. Weather moves faster than climate, a year can be significantly colder or warmer than the one before. The continuity of this region suggests that it is credible.
"Well, lead by example. Lets examine the data, look for errors and ways to allow for them, and then try and figure out what it suggests." I think you are expecting the impossible. Short of going there and discussing the measurements, there is no simple way to do better than we already have.
Just think of what we are trying to achieve here. We are not trying to find the "real" trend, or to get highly accurate records - because, for one, we cannot. We are simply asking if the reported scientific prediction of climate heat catastrophe by 2020 is at all reasonable. It would need a fast (and permanent) upward shift of something over 4C in the next four years to make that prediction come true. Nothing we do to the data, no improved analysis, will answer that question. Even if we could get the wonderful data you seem to think can be somehow got, it would not prove anything. The point if the original post was, simply "this doesn't look likely". It wasn't supposed to be, or claimed to be, a deep technical analysis, just a "We're nearly half way through, how's it going?" post. It looks a flat-out forgone fail to me, but not, so it seems, to you. So let's come back in four years and we'll know the answer.
Re the five year error bars: Errors grow the further out you go. Try shooting at a target 100 m away 50 times and measure your average spread. Now double the distance and try again. If the places five times further away in time only have a 5 year error, then there's no way the error on this place can be anything like 5 years. Here's the funny (to me) thing: every wacky claim from climate alarmists ("it is terrifying") is believed and published as true, but from a skeptic, a simple and reasonable assessment like a close-by error being smaller than a far off error, something that is absolutely reasonable and expected in experimental science - yet it get challenged as if it needs some kind of exhaustive validation. Frankly, it does not. The converse is what would need to be argued, because that is what would be surprising (very surprising).
I don't think I can add any more to this. Let's look at it in four years.
Re: Another failing prediction of doom
"It would need a fast (and permanent) upward shift of something over 4C in the next four years to make that prediction come true. Nothing we do to the data, no improved analysis, will answer that question."
4C ?? Are you using 35.4C as the reference point? It's a shift of around 2C compared with the more likely to be real peak in the 1960's, and that is well within the realms of possibility. We don't know yet, which is why I object to your headline claiming that we have evidence that the prediction is failing. We don't know enough to make such a claim. A couple of degrees in that timeframe with 5 year error bars is entirely possible.
If it doesn't get there, they'll have to admit that either their timing was wrong, or that warming hasn't continued as expected. If it does get there you'll have to admit that the basis for your failing prediction claim was faulty.
And if the 35.4C is going to be used, you've just proved that the temperature can jump 4 degrees in a month, drop by about the same amount next month, and then go back up again. Either we prove that 4 degree rise could happen overnight, or we discard the 35.4C figure.
I don't know enough from the little, very flawed, set of data we have, to say that the prediction is failing. I don't think that you do either.
Oh, and perhaps you can show me where the people who wrote this paper used the terms "terrifying" or "end of the world disaster".
Re: Another failing prediction of doom
"No I don't agree at all. I am discounting everything before Sep 2013 (which is actually a minimum point). After that the yearly average falls about 1C. Weather moves faster than climate, a year can be significantly colder or warmer than the one before. The continuity of this region suggests that it is credible."
And if you start from the middle of 2012, and exclude the 35.4C peak, the trend is flat. Your dotted blue line, what happens to it if you remove the 35.4C peaks? Do you think the new version this would create, or what is indicated on your graph right now would be more likely to reflect reality?
Re: Another failing prediction of doom
Here we go. Did some searching, and finally found that BEST has a data set for MANOKWARI/RENDANI, and seems to be more complete than the Rendani airport record.
berkeleyearth.lbl.gov/auto/Stations/TAVG/Text/155709-TAVG-Data.txt
I'd be curious to see how that looks compared to the graphs we are looking at now.
Also of interest:
www.weatherhq.co.nz/rendani-airport/graphs
www.weatherhq.co.nz/manokwari/graphs
They do read differently, and admittedly I can only look at a 10 day period on that site, but in that time the airport does seems to read slightly higher, sometimes by as much as half a degree.
Re: Another failing prediction of doom
"4C ?? Are you using 35.4C as the reference point? It's a shift of around 2C compared with the more likely to be real peak in the 1960's, and that is well within the realms of possibility."
The prediction is that EVERY year will be hotter than ANY year previously. 4C is just an eyeball guess from looking at the graph, including some seemingly good data much earlier. Since years can easily be 2C different from those around, you need 2C on top of 2C to NEVER fall below the hottest ever year. Look, this whole article was a "doesn't look likely" surmise. It was not intended to be a scientific analysis. You expect me to waste huge amounts of time justifying a "look at this" article, but even if I did, it wouldn't prove anything - which you would undoubtedly then point out. You then add:
"Oh, and perhaps you can show me where the people who wrote this paper used the terms "terrifying" or "end of the world disaster"."
But I don't recall the authors of this study objecting when it was portrayed like this on mainstream media around the world. Frankly, it seems an exercise in plausible deniability: the hairy scary version is reported in big bold headlines, the actual report is more modest, but the scientists never correct the journalists. Sorry if I sound jaded, but I have seen this little trick run over and over. I have no time for it.
Re: Another failing prediction of doom
"berkeleyearth.lbl.gov/auto/Stations/TAVG/Text/155709-TAVG-Data.txt"
Unfortunately this is average temp, not max or min. I have been using max throughout, and sadly their separate max and min directories have no data. Here it is tho:
Re: Another failing prediction of doom
"I have been using max throughout, "
Care to explain the logic behind that? Why exactly is the max more important than the min, or the average?
"The prediction is that EVERY year will be hotter than ANY year previously."
Exactly what did they say? Not the newspaper version. And, how would you graph the data we have in a way that would show whether or not their prediction is likely to be right or not? You are talking about peaks, but then also stating that their predictions are for years being hotter, not months, weeks, or days.
So, what rate of warming would be required to make the years in the near future warmer than the preceding years? If that was their claim, then that should be how we judge it.
Re: Another failing prediction of doom
And, back to the eyeballing the graph thing, which frankly troubles me, because I don't want to fool myself, it doesn't look to my untrained eye that a huge jump in temperature would be required for whole years to be on average hotter than before 2013 when that paper was published. We'll see.
Re: Another failing prediction of doom
"Care to explain the logic behind that? Why exactly is the max more important than the min, or the average?"
I have been doing analysis of US temperature records, and I found that, in particular, the TOBs error, can be reliably identified and quantified in the max but not in the min. Also a recent paper argues, correctly in my mind, that max is a more reliable measure of global warming than min. See
Christy, John R., and McNider, 2016. Richard T. Time Series Construction of Summer Surface Temperatures for Alabama, 1883-2014, and Comparisons with Tropospheric Temperature and Climate Model Simulations. Journal of Applied Meteorology and Climatology 55(3), 811–826, 2016. DOI: 10.1175/JAMC-D-15-0287.1
Average is just a useless measure because you learn nothing about extremes of either heat or cold.
"Exactly what did they say? Not the newspaper version."
"it doesn't look to my untrained eye that a huge jump in temperature would be required for whole years to be on average hotter than before 2013"
Not some whole years, every whole year. The mean has to be so hot that a very cold year is still hotter than before.
Re: Another failing prediction of doom
Hi. I'm going to email BEST to see if I can get hold of the TMIN and TMAX figures.
"Reported temperatures are in Celsius and reflect monthly averages. As
% these files are intended to be summaries for convenience, additional
% information, including more detailed flagging and metadata, may be
% available in our whole data set files."
Hopefully it wont be too hard to get hold of.
"But I don't recall the authors of this study objecting when it was portrayed like this on mainstream media around the world. Frankly, it seems an exercise in plausible deniability: the hairy scary version is reported in big bold headlines, the actual report is more modest, but the scientists never correct the journalists. Sorry if I sound jaded, but I have seen this little trick run over and over. I have no time for it."
I don't care about any of that. The ideological warriors can have that fight all to themselves. All I'm looking at is exactly what prediction was made, and whether or not we can tell from the best (best, as in impressive, not berkeley) data we can get, whether the prediction is impossible, unlikely, likely, or nearly certain.
Re: Another failing prediction of doom
Also, any chance of having the red and dotted blue lines overlaid on that graph?
Re: Another failing prediction of doom
"Average is just a useless measure because you learn nothing about extremes of either heat or cold."
That's rubbish. As if extremes of heat and cold are the only important thing..... Min, Max and average are all useful, and can help you understand different aspects of the climate.
"Not some whole years, every whole year. The mean has to be so hot that a very cold year is still hotter than before."
OK, so put your dotted blue line on the graph above, and then tell me when you expect that this will happen. How much warming is required before whole year averages are higher than any previous years? How long do you expect this to take?
Re: Another failing prediction of doom
Just a thought. A simple bar chart with yearly averages would make it easy to see where we are up to, and how much warmer on average it would need to be to meet their predictions.
Re: Another failing prediction of doom
"Not some whole years, every whole year."
Sorry, that's what I meant. I didn't express it properly.
Re: Another failing prediction of doom
Thinking about tmax, tmin and average:
"Although the errors documented here are true errors (that is, they cannot be adjusted by time of observation or other adjustments), nonetheless it would not be expected that they have much of a direct effect on trends. After all, if one station is consistently overestimated across the years, it will have the same trend as if the values were replaced by the true values. Or if it varies cyclically by season, again after sufficient time the variations would tend to cancel and the trend be mostly unaffected."
https://wattsupwiththat.com/2012/08/30/errors-in-estimating-temperatures...
I understand the issues with averages not taking into account that the temperature may stay close to the max longer than the min or vice versa, but that doesn't make averages useless, and from what I understand, the error will effect the absolute values, but only have a minor impact on the trend.
Re: Another failing prediction of doom
This is my questimate of what is needed to fulfil the conditions given in the original article. The source oval marks where I assume we are now, if average behaved something like max between 2013-2016, the destination oval allows falls of about the size of the biggest fall below the trend line, without falling below the yearly average peak.
Whether this is exactly right is a matter of opinion. This was never intended to be a scientific analysis, as I have said before, just an "it doesn't look remotely likely" opinion post, which you are free to agree with or not. I really don't think picking it apart in any greater detail is useful. But if you do, please post your own analysis.