When I started looking into the claims of dangerous warming due to carbon dioxide, I was completely baffled, buried in details of climate models, puzzled by energy balance diagrams, and so forth. Was there a "greenhouse" blanketing the Earth, slowly frazzling us to death? The truth could have been anything. If you've followed this path too, you'll know what I mean. But one thing, one single piece of the jigsaw, cut through all the fog and answered the question. I want to show you the thing that absolutely clinched the global warming question for me. I have postgraduate training in physics, which helped, but the basic point is understandable by anyone, and in this article I want to explain what seems to me the key, conclusive fact in everyday terms.
Let's say it's a cold night and Fred climbs into bed:
 (A) Fred in bed.
Will Fred use a blanket to keep warm? If so, the air will heat up close to Fred because his body warms the air and the blanket prevents it from moving away. On the other hand, as the night progresses, the air beyond the blanket will cool:
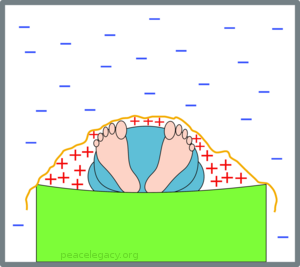 (B) With a blanket, the warm air collecting around Fred warms him up.
In the picture, the "+" signs show air that becomes warmer, and the "-" signs air that becomes cooler.
Now what if Fred (forgetful Fred) didn't use a blanket? The warm air escapes and tends to rise (warm air being less dense than cold air):
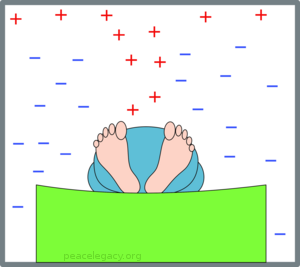 (C) With no blanket, warm air escapes and Fred shivers.
Poor Fred gets colder as the night wears on. But now we come to the point of the exercise: How do we know whether Fred used, or did not use, a blanket?
"Easy," you say: "Take a look!" But let's suppose that Fred is a very light sleeper, we dare not put on the light, so there's no way we can see if there's a blanket. But—surprise!—we just happen to have an infra-red scanner that can tell us the temperature of the air at various spots throughout the room. Depending on whether Fred uses a blanket, the temperature change in the room follows one of the two characteristic patterns we saw above; so if we check where the air gets colder and where it gets warmer as the night wears on, we know, for a fact, whether or not Fred used a blanket, even without being able to see it. If Fred did use a blanket, our scanner should show results like this (note how we can't see the blanket, but we can be sure that it is there):
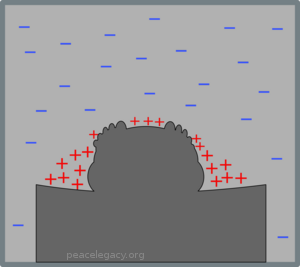 (D) Warm air collects in a contained region, so there must be a blanket.
On the other hand, if he does not use a blanket, we will see the temperature change in a pattern something like this:
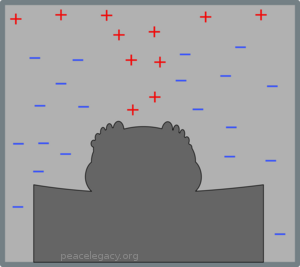 (E) Warm air escapes upwards, so we are sure there is no blanket.
Once again, there is no doubt at all what is going on. In science, nothing is absolutely certain, but depending on which temperature pattern develops, we can be very, very sure indeed of the answer to the question: Did Fred use a blanket?
Now we can turn to the global warming question, whether the Earth is surrounded by a 'blanket' of anthropogenic (human-generated) greenhouse gas stoking up the temperature of the planet. The physics of a real blanket (as with Fred in the fable above) and a gaseous 'blanket' around the Earth differ, but just the same, different heat dissipation (or retention) processes will result in different characteristic patterns of temperature change. Just as Fred will be surrounded by something roughly resembling one of two quite different patterns of air temperatures, so likewise will temperature changes around the Earth have a quite definite pattern, depending on which climate theory is right. Scientists whose paycheck does not depend on agreeing with global warming alarmism will all agree with this simple statement. It's part of the basic skill of having a 'nose' for physics.
What, then, are our main competing climate theories? The IPCC's reports are based on results from a collection of climate computer models; they have nothing else. These are simply computer programs that, in essence, contain a computerised version of the assumptions and beliefs of the climate modeller as to how the climate of the planet works. Whether these assumptions are well-founded is another question, but the key point is that whatever these assumptions may be, when the climate model is run, it generates its 'predictions' by calculation of hypothetical futures for the behaviour of the atmosphere. These 'futures' contain, as an essential element, predictions of the changes of atmospheric temperatures at various heights above the planet and the various latitudes all the way from south pole to north pole.
The indisputable fact about these atmospheric temperature predictions is that if the pattern doesn't happen, the model is wrong. Just as Fred won't warm up if he isn't surrounded by warm air, likewise the effects on the Earth of global warming cannot happen if the cause of the warming —the warm air—isn't there.
So now we come to the graphs that clinch the matter. All global warming models predict some sort of developing 'hotspot' in the atmosphere above the tropics. Here is the graph for one of the models, but they all look roughly similar:
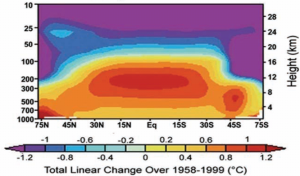 (F) Model predicts air above the tropics heats up. from the NIPCC Report p. 107
This picture shows the air from 75 degrees north to 75 degrees south (the equator in the middle) and up to 30 km above the Earth. We can think of this air pattern as corresponding to the pattern in Fred's bedroom when Fred used a blanket: although the actual mechanism is different, something is 'keeping the heat in', so to speak. Just as we did with Fred in bed, we can compare reality with this picture. Is the heat in the real atmosphere doing what the model predicts? Here is the temperature trend in the real world:
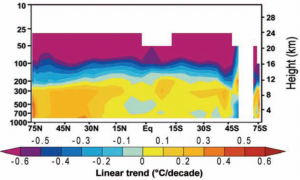 (G) Real world trend develops no hotspot. from the NIPCC Report p. 106
What have we actually proved here? Well, proved, without possibility of error, nothing, of course: no question at all about the real world ever has a complete perfect proof as an answer, so don't be misled if someone says the world still might be heating due to CO2 despite the absence of the warm spot that is supposed to do the warming. Of course anything might be happening; but how likely is it? Well how likely is it that Fred has a blanket, but the air around him is getting colder just as if he had no blanket, and yet Fred is warming up despite that? The two questions have the same answer: not very.
Yet surprisingly, some proponents of global warming alarmism actually resort to this very strategy. "True," they say, "the hot spot isn't developing. But that is because the heat is being stored up elsewhere—it's "in the pipeline"—and one day it will burst forth with even greater severity and vengeance."
What can we make of that claim? Well, thinking back to Fred again, it amounts to this: We use our temperature probe in Fred's darkened bedroom and we see a pattern like that in (E) above, corresponding to no blanket: Fred should be freezing! But actually, the heat has all gone into Fred's body, despite the complete absence of the hot air which is the mechanism for making it do so. In other words, Fred got warmer by disobeying the second law of thermodynamics—in other words, by magic. Likewise, if someone says heat is being secretly stored somewhere by global warming, despite the absence of the very mechanism that does the warming, they are saying global warming is happening by magic. That is the harsh truth of the matter.
One thing I have learned whilst studying the global warming question is that, like many other physical systems, the climate is constrained by limits that can be understood by any intelligent person willing to learn some simple physics. The 'hotspot' is one of them. Anyone talking down to you and telling you you have to take the word of some mythical 'consensus' of 'experts' is trying to hoodwink you.

Re: How to see for yourself the 'Global Warming' climate ...
Someone asked a good question on one of the newsgroups:
> Good stuff.
>
> But you're a physicist. The properties of the molecular bonds of CO2 are
> such that they impede the movement of infrared radiation for the earth to
> space - leaving to one side by how much for one moment - do you accept
> that or not?
But you can't leave that aside. Example: You can raise world sea levels by tipping a teacup into the Pacific Ocean. But the entire point precisely is: by how much?
CO2 has a single absorption band in the main emission region (infra red) for radiation from the Earth. The planet's emission spectrum shows that this band is about half absorbed. Mars has a very similar emission spectrum to Earth's, yet it has about nine times the CO2. One way to understand that fact is that the rest of the infra red emissions are coming from the surface, whereas wavelengths in the CO2 absorption band (CO2AB) coming from the surface are entirely absorbed, as the atmosphere is over 100% saturated with CO2 as far as absorption purposes go. Therefore emitted light in the CO2AB is actually emitted by an upper atmosphere layer where CO2 has a 'free line of sight' to outer space - and that layer is colder than the surface, and hence emits at a lower power level.
Increased CO2 can change the finer details of this emission spectrum, but not by very much. To get the same power output out into space, the planet must heat up enough that the total power envelope (the area under the curve of its emission spectrum) is the same as before. The Stefan- Boltzmann law states that intensity increases with the fourth power of the temperature. That is huge, and it means that only a small temperature change is needed to compensate for any possible change to the output in the CO2AB - even if the planet (magically, because no physical process can bring this about) stopped emitting entirely in this band, no great increase in temperature would be needed. People who have calculated in detail this tell us that the temperature will increase according to the log of the CO2 concentration (logarithms increase extremely slowly), but even that sounds excessive to me, but until I get a chance to do the calculations for myself I'll take their word for it.
Everyone accepts this basic argument; the only question hinges around whether positive feedback somehow amplifies this small temperature increase. The IPCC models say yes, and by assuming high positive water vapour feedback, they predict significantly increasing temperatures. The models predict this big increase because, in the detail of their operation, they show a 'hot bolus' developing in the atmosphere over the equatorial regions. The point highlighted in my blog post is precisely that this hot bolus has not developed. It must for their proposed mechanism to work. It hasn't. Therefore their assumption of high positive feedback is incorrect.
Re: How to see for yourself the 'Global Warming' climate ...
The relative humidity at the equator in the lower atmosphere is high. Increasing the CO2 at the equator does not increase the air temperature. It actually cools it slightly because CO2 absorbed by H2O stores less heat in the lower atmosphere than uncombined CO2 or H20 molecules.
One feature of this combination is the ability to form micro water droplets. Micro water droplets are the precursor to the formation of larger droplets as the air rises. Heat is released when the CO2 & H2O molecules are attracted to form the micro droplet. The micro droplet grows in size by combining with other micro droplets and thereby releasing more heat and the air rises faster.
More CO2 will mean more micro droplet formation at the equator and more rainfall over equatorial oceans, rainforests and coastlines. It also causes a slightly lower air temperature for the lower equatorial atmosphere compared to air with lower relative humidity but similar IR exposure near the equator.
The atmosphere is regulated.
On a macro level if there is more CO2, it rains more, causing more vegetation which stores more carbon, so there is less CO2 which causes less rain. There is a big time lag in this process. History shows us that it takes 500+ years for a large city to completely disappear because of this process changing. Cutting down old growth forests at the equator means less CO2 production at night and less rainfall the next day. The relative humidity produced above a young forest is not much different from an old forest. The CO2 output at night is lot different. So cities did not cut down all their forests with no replanting. They just cut down all their old forests.
On a micro level more CO2 causes more heat release which causes more micro droplets which causes more rain which reduces atmospheric CO2.
More rainfall at the equator causes higher surface water temperatures when that rainfall occurs over oceans. Higher water temperatures means stronger eastern seaboard ocean currents. These currents reduce rainfall at higher latitudes on eastern seaboards and increase rainfall on western coastlines at similar latitudes. There is a pendulum effect caused by gravity from one continent to another. We see this event as an oscillation in relative humidity and ocean level. The oscillation frequency varies as it is affected by the position of the moon.
Re: How to see for yourself the 'Global Warming' climate ...
Good stuff Ron. Your point on saturated absorbance bands reminds me of a similar point that I've never seen satisfactorily rectified. The new rage is for people to call GHGs "heat trapping gases". This to me is a contradiction in terms. By heat trapping gases I assume they are referring to the higher specific heat capacity of CO2. But doesn't this really mean that CO2 can store more heat than our standard air mixture before an increase in temperature is observed? The answer is yes unless the system is fully saturated with heat which can never actually happen. Now of course the issue you speak to in your post is often cited as offsetting this, which it must, otherwise you could only argue that increasing CO2 would be BENEFICIAL to stabilizing temperatures. But even skeptical scientists who disagree with the whole absorbance issue still accuse CO2 of causing warming, and I think they're guilty of only looking at half the picture. I think the belief is that because CO2 can hold more heat, that via the first law of thermodynamics, during cooling this heat flows out of the CO2 and into the "good" air and making it warmer. I disagree. Fact is the atmosphere is a "system" where everything is interacting with everything else. And in such a system equilibrium is the driver. So as air gets warmer in the presence of CO2 it expends a lot of energy helping CO2 'keep up' with its temperature increases, and as a result the net temperature rises more slowly. On the cooling side the opposite happens. Yes CO2 has stored more heat, and by the same mechanism effectively slows cooling. And while this may make CO2 seem like an evil warmer, lets not forget conservation of energy. The AMOUNT of heat in the system is still the same. So all CO2 really does is change where the inflection points are when you graph the rise and fall of temperature of the system.
This is (one of) the fundamental flaws in the alarmists claims of "2007 was the 3rd hottest year ever". While its true, it is an insignificant and not unexpected point. The 1998 El Nino released heat stored in the oceans and added extra heat into the atmosphere. This led to record high temperatures, but ones that could be accounted for without crying Global Warming. However from that maximum, temperatures have fallen, but perhaps slower than expected (when extrapolated from historical models) in response to increased CO2 in the atmosphere. So even though a clear cooling trend can be observed alarmists try to focus you on the fact that, due to slower cooling, temperatures are still above average. But above statement is true only because the current cooling started from an uniquely high starting point, and is slowed by higher CO2 content in the atmosphere. It doesn't negate the fact that we are cooling even as CO2 goes up. Problem is as much as people love to point out the former, they consistently, and (I think) purposely leave out the equally significant latter truth. Instead the alarmists belabor the effect of this slower cooling with the implication that the cause will also mean faster warming. Not true. CO2 slows the temperature response of the atmosphere to any heat or lack thereof equally and in both directions. A clever omission, likely to fool even an educated person not privy to all the intricacies of thermodynamics. Nonetheless totally false. In fact I believe time will see "warming" events become less and less frequent and severe the higher atmospheric CO2 concentrations rise. Continuing to expose the fallacies of this flawed theory.
Thoughts?
Re: How to see for yourself the 'Global Warming' climate ...
There has been atmospheric cooling the last 8 years, and no new high global annual temperatures in the last 11 years. None of the computer models replicate this fact. Anthropogenic (or man caused) global warming is not proved.
The global warming adherents base their argument of proof on more than 20 different computer models called general circulation models (also known as global climate models or GCMs). Each computer model is composed of dozens of mathematical equations representing known scientific laws, theories, and hypotheses. Each equation has one or more constants. The constants associated with known laws are very well defined. The constants associated with known theories are generally accepted but probably some of them may be off by a factor of 2 or more, maybe even an order of magnitude. The equations representing hypotheses, well, sometimes the hypotheses are just plain wrong. Then each of these equations has to be weighted against each other for use in the computer models, so that adds an additional variable (basically an educated guess) for each law, theory, and hypothesis. This is where the models are tweaked to mimic past climate measurements.
The SCIENTIFIC METHOD is: (1) Following years of academic study of the known physical laws and accepted theories, and after reviewing some data, come up with a hypothesis to explain the data. (2) Develop a plan to obtain and analyze new data. (3) Collect and analyze the data, this may even require new technology not previously available. (4) Determine if the hypothesis is correct, needs refinement, or is wrong. Either way, new data is available for other researchers. (5) Submit results, including data, for peer review and publication.
The output of the computer models run out nearly 90 years forward is considered to be data, but it is not a measurement of a physical phenomenon. Also, there is no way to analyze this so called data to determine if any or which of the hypotheses in the models are correct, need refinement, or are wrong. Also, this method cannot indicate if other new hypotheses need to be generated and incorporated into the models. IT JUST IS NOT THE SCIENTIFIC METHOD.
The worst flaw in the AGW argument is the treatment of GCM computer generated outputs as data. They then use it in follow on hypotheses. For example, if temperature rises by X degrees in 50 years, then Y will be effected in such-and-such a way resulting in Z. Then the next person comes along and says, well, if Z happens, the effect on W will be a catastrophe. “I need (and deserve) more money to study the effects on W.” Hypotheses, stacked on hypotheses, stacked on more hypotheses, all based on computer outputs that are not data, using a process that does not lend to proof using the SCIENTIFIC METHOD. Look at their results, IF, MIGHT, and COULD are used throughout their news making results. And when one of the underlying hypotheses is proven incorrect, well, the public only remembers the doomsday results 2 or three iterations down the hypotheses train. The hypotheses downstream are not automatically thrown out and can even be used for more follow on hypotheses.
Re: How to see for yourself the 'Global Warming' climate ...
Hi Geoff, Yes, if I understand you rightly, CO2 dissolves readily in H20, so it must be a lower energy state and so gives off heat in the process. The heat goes into thermal motions which raises temperature, which causes the air to rise. As it rises it cools, clouds form, rain falls, air cools. More CO2 increases the process and regulates the temperature. Makes sense.
The thing I find truly remarkable about physics is the way an 'envelope' explanation such as mine about emission spectra always dovetails with a 'micro' explanation such as yours about a regulation mechanism.
About cutting old growth forests, I wonder if we thereby lose some of the resilience of the system? I do believe humans can affect the planet; heavy metal pollution, deforestation, destruction of habitats, etc. What is so perverse about our present situation is that the main thing we are doing that is right, namely increasing the atmospheric CO2 to provide more plant food, is the only thing that has been demonised. It seems as if the powers that be want to keep all the destructive actions and prohibit the constructive ones.
Re: How to see for yourself the 'Global Warming' climate ...
Hi Derek, I just checked the specific heat capacity of CO2, and it is less than that of either O2 or N2. I suspect the term "heat trapping gases" is just a bit of sloppy terminology, probably trying to summarise the entire CO2 greenhouse model without thinking too hard about what they are actually saying.
I don't think, though, that heat stored in CO2 molecules themselves can matter much to temperature, mainly because in Earth's atmosphere the CO2 is such a very tiny fraction of the total. Marginal differences in heat capacities wouldn't make any noticeable difference. There is an 'equipartition theorem' in physics that says that average energy is equalised over all available degrees of freedom. There are three 'translational' degrees of freedom corresponding to movement in three dimensions, and complex molecules such as CO2 have additional rotational and vibrational degrees of freedom. So you are right that some energy will be used in 'powering up' the accessible additional degrees of freedom of molecules like CO2. However, the fraction in the atmosphere is so low that this could not make more than a tiny change to the heating behaviour of the atmosphere as a whole. That brings the question back to the absorption and emission issues I discussed previously. One other point, though, is that exchange of energy between these degrees of freedom will provide a mechanism by which absorbed photons can, instead of being re-radiated, be transferred into translational motion of molecules of all ypes (and thus raising temperature).
This is quite a tricky subject and I notice contradictory statements about it by physicists themselves. One reason I like to stick to reasoning about overall limitations than about detailed internal behaviour is that the former is so much easier!
Re: How to see for yourself the 'Global Warming' climate ...
Hi NucEngineer, Yes, the cooling is another bald fact that the models fail to replicate. I concentrated on the heating pattern (rather than the direction of change) because I got to have fun drawing some cute pictures!
As for the scientific method, of course you are right, but what can one say? If they cannot see the deplorable state of their non-science, I doubt any rational appeal will help. Unfortunately I don't think it is merely the case that their bad science will waste money. As I discussed in an earlier article, there's an ice age coming sooner or later, and the less CO2, the worse plants will grow and the lower temperatures will be (by whatever amount). Warming alarmism is positively dangerous to life.
Re: How to see for yourself the 'Global Warming' climate ...
Hello Ron,
Nicely done analogy. Would you consider allowing me to repost it at wattsupwiththat.com ?
Also, it would be helpful if you could list the original source of the graphs F and G
Thanks for your consideration.
Anthony Watts
Re: How to see for yourself the 'Global Warming' climate ...
"Consistency of Modelled and Observed Temperature
Trends in the Tropical Troposphere", by B.D. Santer et al.
Abstract
Using state-of-the-art observational datasets and results from a large
archive of computer model simulations, a consortium of scientists from 12
different institutions has resolved a long-standing conundrum in climate
science - the apparent discrepancy between simulated and observed
temperature trends in the tropics. Research published by this group
indicates that there is no fundamental discrepancy between modeled and
observed tropical temperature trends when one accounts for: 1) the
(currently large) uncertainties in observations; 2) the
statistical
uncertainties in estimating trends from observations. These results refute
a recent claim that model and observed tropical temperature trends
"disagree to a statistically significant extent". This claim was based on
the
application of a flawed statistical test and the use of older observational
datasets.
Re: How to see for yourself the 'Global Warming' climate ...
Hello Anthony, I greatly appreciate your kind thoughts. I have been following wattsupwiththat and climateaudit since I started looking into the whole question in September '08, and they have been of the greatest assistance to me. I soon learned that real climate and friends were more ad hominem than science, but the difference in quality, courtesy, and basic humanity was not the thing that made up my mind, it was indeed this very atmospheric divergence. I must have found it originally on either your or Steve's site, but I don't recall which.
I would be very happy for you to reprint in wattsupwiththat. The originals for F and G are from the NIPCC Report, one on p 106, one on p 107. I'll add that to the article, thanks for pointing that out that omission.
Ron
Re: How to see for yourself the 'Global Warming' climate ...
"Research published by this group indicates that there is no fundamental discrepancy between modeled and
observed tropical temperature trends when one accounts for: 1) the (currently large) uncertainties in observations; 2) the statistical uncertainties in estimating trends from observations. "
Typical of the dogmatic religion. The models MUST be right and observations wrong. Welcome to the world of the New Science where reality lives in software and the outside world does not exist.
Re: How to see for yourself the 'Global Warming' climate ...
Hi Fred, re the Santer paper.
Firstly, this paper is not science, it is advocacy. The paper you want that demolishes it utterly is: “An updated comparison of model ensemble and observed temperature trends in the tropical troposphere” Stephen McIntyre(1), Ross McKitrick (2) here.
Why isn't it science? Because the "researchers" refuse to release their data! Quoting from McIntyre and McKitrick:
That's putting it far more politely than Santer and friends deserve! The scientific enlightenment was one of the key historical developments that brought about the modern world. Enemies of it, who subvert science or subvert free and open debate, deserve no respect, and they risk casting our civilisation away in favour of superstition and obscurantism. Santer has committed himself to anti-science by trying to get research credits without submitting to scientific reproducibility checks.
One also notices amongst the authors of Santer's paper (Santer, B. D., P. W. Thorne, L. Haimberger, K. E. Taylor, T. M. L. Wigley, J. R. Lanzante, S. Solomon, M. Free, P. J. Gleckler, and P. D. Jones.) the name of P. D. Jones. According to http://www.cru.uea.ac.uk/cru/pubs/byauthor/jones_pd.htm, this is the same P. D. Jones employed at CRU who is currently at the centre of a scandal over erasing data that is subject to a freedom of information request.
So to summarise, my response to this non-paper is in two parts:
It is necessary to understand that the warming alarmism is not merely wrong, it is a deliberate scam, and it is financed to the tune of billions of dollars. I have personally identified over a billion dollars in Australia alone. Regardless of whether any particular researcher is in on the scam or merely going where the money allows, with that kind of money at stake, any evidence that the scam is just that will be met with well-financed, seemingly solid, but typically flawed, "research" seeming to rebut the evidence. So before posting such a comment on this topic in future, please take time to write to the author of the paper and ask for a copy of all data and all program code used in production of their results. If you get it, then and only then put up that paper as a scientific contribution that needs to be evaluated. Otherwise, ignore it.
Re: How to see for yourself the 'Global Warming' climate ...
you are kidding right? you are telling me that you know exactly what will happen with the currents and rain based on warmer water temperatures? And it's all good, a negative feedback mechanism? That's worse than the climatologists (who also claim to know more about the future than they do but at least have a degree and a profession in this) saying they know exactly what will happen with the weather. Weather as anyone knows, is practicably unpredictable, especially once you start messing around with the system, which is what you are proposing!
Worse yet, you know that warmer oceans produce more C02 and don't mention it. Also you are saying that more forests are going to grow because on western coastlines to soak up more C02? What western coastlines are you talking about, those fertile ones of Chile and Mexico/California? Oh yeah, that's likely. The forests are all being chopped down by the people you are giving psuedo-science to in their mad rush to convert as much natural resources as possible into their bank accounts as quickly as they can. You ought to be ashamed of yourself.
[RH: Are you replying to Geoff Croker? I can't find any other mention of western coastlines.]
Re: How to see for yourself the 'Global Warming' climate ...
And be sure to watch out for those black helicopters. They are after you and your freedom!!!!!!!!!!!!!!!!
You speak about Global
You speak about Global Warming as if it was the biggest problem in the world. I agree that this question must be solved as quick as possible. But we also shouldn't forget about garbage problems, animal extinction and the problems of this kind. Very often I watch Discovery Channel and Animal Planet [Link snipped - does not appear to target anything relevant] and see how difficult the situation here is. And it need our attention, too.
[Response - You are quite right about other problems. And any energy wasted on the non-problem of AGW is energy that could have been used to fight real problems.]
Re: How to see for yourself the 'Global Warming' climate ...
An interesting article from the UK:
http://www.guardian.co.uk/environment/2009/nov/20/climate-sceptics-hacke...
Pat
Re: How to see for yourself the 'Global Warming' climate ...
Hi Pat, yes, this is pretty shocking. Wattsupwiththat had a good article about it.
Re: How to see for yourself the 'Global Warming' climate ...
About the analogy with the guy in the blanket. The room itself acts as a blanket, too. I didn't care for the article that much. That's all. Thanks though.
"Stratospheric Cooling"
Ron:
Brilliant exposition. But I wanted to point out to you that it seems that certain of what I call "tropospheric temperature trend deniers" have resorted to claiming that the difference between GCM predictions of tropospheric temperature trend and ACTUAL tropospheric temperature trend is explained by the effect of "stratospheric cooling" on tropospheric temperatures (See Fu et al, 2004 - link below). Here's how their story goes.
In addition to predicting a "tropospheric hotspot" (i.e., more warming in the troposphere than at the surface, specifically by a factor of 1.2, globally), the GCMs also predict that the stratosphere will show marked cooling if anthropogenic emissions of greenhouse gasses are the culprit. And observations of stratospheric temperatures do, in fact, confirm this GCM expectation (though other, non-anthropogenic sources of warming could also result in stratospheric cooling). But, more importantly, the cooling of the stratosphere will cause the troposphere, in turn, to cool as well, thus mitigating some portion of the tropospheric warming predicted by the GCMs. Fu et al go to great lengths to extract this "stratospheric cooling" signal and remove it from the tropospheric temperature trend, in the end showing that the "adjusted" global tropospheric temperature trend is pretty close to the GCM predictions, and that the "adjusted" tropical tropospheric temperature trend is right on the money compared to model predictions.
Here's my problem with Fu's "adjustment". The GCMs PREDICT stratospheric cooling. And the mechanism by which the stratosphere cools the troposphere is one of simple heat diffusion. So, surely, the authors of the GCMs took this into account. To accept the notion that actual tropospheric temperatures need to be "adjusted" before comparing to CGM predictions, necessitates the belief that the authors of the GCMs COMPLETELY FAILED to incorporate the effects of stratospheric cooling into their models! I, for one, don't believe that they were QUITE that stupid. And even if they were, then surely, once the tropospheric temperature trend deniers started pointing this out (and they've been doing so since at least 2004), surely the GCM authors would have gone back and re-calculated the tropospheric temperature trend, including tropospheric cooling. But I see no indication, anywhere, that this has been done. So it seems obvious to me that this effect was included in the GCMs, which would make any "adjustment" for the effect of stratospheric cooling completely inappropriate.
But, let's say I've completely underestimated the stupidity of GCM authors, and they DID, in fact, completely fail to include the effect of stratospheric cooling in their models. While this might mean that "adjustments" a la Fu et al are appropriate, it is still just as damning to the accuracy of the models. The models say that the troposphere should warm 1.2 times as much as the surface. Applying this factor to the observed surface warming of 0.17 C/decade over the last 30 years yields a GCM-predicted tropospheric warming of about 0.20 C/decade. The actual observed tropospheric warming has been just 0.09 C/decade (that's according to RSS; according to UAH it's about half of that). So, even using RSS for actual tropospheric temperatures, over half of the expected tropospheric warming is being sucked off by the stratosphere. But it is this tropospheric warming that is supposed to be causing all the surface warming - that's what the greenhouse effect IS, after all. And if half of the tropospheric warming is just MISSING, then half of the surface warming predicted by the models will not materialize. So the GCMs, if they fail to include the effect of stratospheric cooling, are over-predicting surface warming by a factor of 2.
Either way, the models are dead wrong.
That's my analysis of this "stratospheric cooling" explanation. Anyone have any input?
Regards,
Trevor
Re: "Stratospheric Cooling"
Hi Trevor, Thank you, and thanks for explaining that recent development.
I agree with your analysis. Essentially, the GW theory has it that CO2 somehow impedes heat flow from the surface. The recent objection, if I understand you, is that the models don't correctly take account of heat flow between the troposphere and the stratosphere. Intuitively, anyone would ask: why trust such a model for getting right the flow between the surface and the troposphere if it wrongly predicts the flow between the stratosphere and troposphere? Your explanation shows: we shouldn't trust them.
Regards,
Ron.
Re: How to see for yourself the 'Global Warming' climate ...
That study basically says that the measurement and modelling are so imprecise that they are basically garbage. Throw everything out then. Start again from blank says study.